Dragonhunter281's stats
- Review count57
- Helpfulness votes1,648
- First reviewApril 19, 2014
- Last reviewMarch 13, 2024
- Featured reviews0
- Average rating4.6
- Review comment count1
- Helpfulness votes4
- First review commentOctober 31, 2016
- Last review commentOctober 31, 2016
- Featured review comments0
Questions
- Question count0
- Helpfulness votes0
- First questionNone
- Last questionNone
- Featured questions0
- Answer count3
- Helpfulness votes6
- First answerSeptember 20, 2016
- Last answerAugust 24, 2017
- Featured answers0
- Best answers1

The Shark Stratos Upright is Shark’s most powerful, whole-home cleaning vacuum. It has the most powerful suction & best hair pick up of any Shark. At the nozzle, Stratos delivers on the innovation, packing our most advanced cleaning technologies into its low-profile frame. The DuoClean PowerFins HairPro nozzle grips & captures more dirt, debris & hair, for incredible pickup of all types of debris. Large piles, fine dust, and short & long hair are no match for DuoClean PowerFins HairPro. For above-floor cleaning, you can Lift Away the detachable pod and take your cleaning to stairs, furniture, windowsills, and more. Plus, when you lift away the pod, you transform your vacuum into a stick, for easy motorized cleaning under furniture. Shark’s new Odor Neutralizer Technology guards against bad odors inside your vacuum, leaving you with a fresher-smelling home. Plus, Anti-Allergen Complete Seal with HEPA filtration seals and traps 99.9% of dust, dander, and allergens inside of the vacuum, and out of the air you breathe.
Posted by: Dragonhunter281
While searching for the perfect vacuum cleaner is sometimes difficult, as every person will have different needs, there are some features that allow certain models to differentiate themselves from the rest. As such, as a previous owner of two shark vacuum cleaners, the Shark Duo Clean Slim (Model NV201) and its current generation (Model: ZU782), I have been impressed with the overall performance of their vacuum cleaners for quite some time. Both of these models are more compact than the rest of the lineup, so naturally I was extremely excited to test their latest flagship, the full size Shark Stratos (Model: AZ3002) and was curious to compare it to our previous models.
Once you open the box, the Stratos is very similar as other previous Shark vacuum cleaners. The installation is fairly straightforward and most should have no issue. Physically, the Shark Stratos is much larger than our previous units. The weight clocks in at roughly 17 pounds and has a really sturdy feel to it. As with previous shark models, the middle detaches from the base of the vacuum cleaner allowing you to clean in a more portable fashion. For cleaning control, the Stratos has three different presets located on the handle: bare floor, carpet, and thick carpet. Next, you will also note the new feature with the Stratos: the odor neutralizing cartridge. This will need to be installed on the base of the unit and should be replaced every six months. Moving on, the Stratos is included with a few accessories: the crevice tool for baseboards and hard to reach areas, the upholstery tool, and lastly the hair pro brush. Lastly, comparing the Stratos to our previous cleaners, the only feature that those other cleaners have over the Stratos is the ability to control the suction strength on the hose. Additionally, the power button was moved to the handle on the Stratos; our others had it next to the wand compartment.
Upon cleaning for the first time with the Stratos, the handling of the vacuum cleaner was quite amazing. It has a fluidity that is hard to describe. The base of the unit swivels around when you turn left or right. The LED on the front was also a nice touch, especially for hard to see areas. I was also quite impressed with the odor neutralizing cartridge. On the recommended highest setting, I was able to immediately tell the room was starting to smell fresher. In addition, with a household of three cats, the Stratos handled my cleaning task with no issue. I was able to consistently fill the dust container to its maximum in each room. The Duo Clean feature and the self cleaning rollers seemed to work as intended. As I finished a pass in each room, there was nothing stuck or clumped up in the rollers.
The next test that I wanted to do was test the Stratos by removing the base of the unit and clean with the hair pro attachment. I decided to stress test this by cleaning our stairs that almost certainly was full of cat hair. As I began rolling the hair pro attachment over the stairs, the carpet began to fluff up as I continued moving in an up and down fashion. Next, I would then pass over each stair a second time from left to right. After roughly ten minutes of cleaning, I was quite excited with the results. For us, I believe this was the first vacuum cleaner that did not seem to lose any suction power with any of the included attachments. In addition, the hair pro attachment did not have any hair or debris stuck in its fins. It is fair to say that this was certainly the first vacuum cleaner we have owned that the suction with the hose matched that of regular vacuuming. The Stratos has stronger suction power than even our previous shark cleaners. For my final test, I decided to take the crevice tool and go back over our stair case. Before I started, I went ahead and dumped the dust bin and then proceeded to run the tool at the base of each stair. I could immediately feel the carpet being grabbed from the immense suction, even from the severely limited slit of the tool. Naturally, this was quite exciting. Once I completed my final pass, I was able pick up even more debris that was missed with the initial pass. Also, keep in mind that when you have the base removed, the odor neutralizing component is not used. Lastly, I also noticed that the cord attached to the vacuum cleaner was the longest we have seen as I was able to clean from top to bottom of the stairs without having to unplug the cord.
In conclusion, the latest Shark Stratos is in every way the flagship it was designed to be. The suction power of the Stratos is strongest we have ever used. Furthermore, the suction was not hampered by any of the included accessories and continued to perform exceptionally. In addition, we did not have any hair or debris buildup of any kind on either the hair pro accessory or the base of the cleaner. I was also impressed with the odor neutralizing cartridge as it seems to work as intended. Overall, the Shark Stratos has everything going for it, despite sitting in the upper price range. Thus, the Shark Stratos comes highly recommended.
I would recommend this to a friend!


Share this review:
+12points
12of 12voted this as helpful.
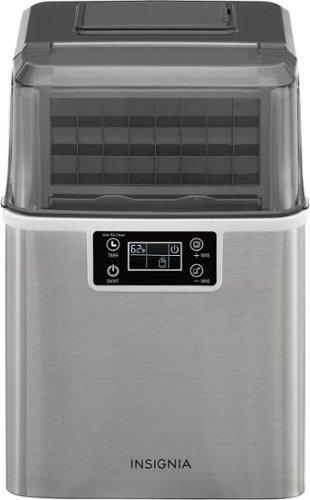
You’ll never run out of ice with the Insignia NS-IMC44S3 Portable Clear Ice Maker with Auto Shut-off. Producing up to 31 lbs.* of ice per day, this icemaker stores up to 2.6 lbs., enough to supply for any at-home get-together. It creates clear ice every 14 minutes, keeping your guests’ content and their beverages cold. Produced ice is clearer than other types of ice, resulting in cubes that melt slower and create less fizz. It has a large 3.4-quart water tank that recycles melted ice, requiring fewer refills. A digital control panel with indicator lights make this portable icemaker safe and easy to operate. Match the icemaker to your kitchen décor with a modern stainless-steel design that will look great in nay kitchen. Become the best party host on the block with a portable icemaker that keeps up with you and your guests’ expectations.
Posted by: Dragonhunter281
In the past, we have used several portable ice makers that have worked well enough for our needs. While larger ones existed back then, we traditionally only purchased smaller units. As luck would have it, the ice machine in our freezer unexpectedly stopped working. Naturally, we now needed a larger ice maker to make multiple rounds of ice. Thus, as you might expect, I was extremely excited to try out the Insignia ice maker to see how it would perform given our needs.
As you unboxed the insignia ice maker, it was quite evident that this was the largest unit we have used. While somewhat large and taller than expected, it was still extremely elegant; moreover, it looks quite stylish in the kitchen. The brushed aluminum finish has a nice feel to it and matches our other appliances. Once opened, you will note several items including the ice basket and a scooper. On the front of the unit, everything should be straight forward: you will note the power button, timer button, and the thickness buttons (ranges -3 to +6). Before testing the unit, there are a couple of things I would like to mention before you prepare your first batch of ice. First, upon prepping the unit, as noted in the instructions, the ice maker should rest upright for four hours to allow the refrigerant to settle in position. Next, we filled the tank with 2 liters of water then initialized the self cleaning session by holding the timer for five seconds. Another important reminder is that you should always use clean water that is soft in nature. To accommodate this, we filtered our water using a Zero Water filter. Lastly, the water temperature should be within 50-77F. After that, the ice maker was then ready to create its first blocks of ice!
For my first test, I immediately used the filtered water at room temperature and filled it to its full capacity. I left the thickness setting at default and started the machine. After a couple of minutes, the timer initialized itself; the first batch will be ready in approximately in 13 minutes. While the ice was being made, the noise level wasn’t as loud as I expected it to be. Additionally, as the machine repeated the ice making process, each batch finished slightly quicker. Furthermore, I was able to get seven batches of ice, with about 25% of the tank still full. The ice cubes were of good quality; clear and transparent. This was quite a drastic improvement from our previous ice machine. As far as texture, the ice was overall wet to the touch so I was curious to see if by increasing the thickness it would yield a different result.
For our second test, I decided to use colder water from the fridge that measure around 66 degrees. In addition, I wanted to see if the thickness setting would have caused any drastic changes to the overall texture to the ice. Before starting it, I changed the setting to the maximum (+6). Naturally, this increased the time between ice making intervals by 6 minutes. Additionally, this also increased the amount of water used in each cycle. To my surprise, there was a notable improvement to the ice as it wasn’t as was wet to the touch. It was much more solid. In addition, the ice was slightly heavier and thicker, though I do want to caution to keep your expectations reasonable. Afterwards, we let this setting continuously run until it was low on water. As expected, it did not make as much ice as before; yielding only about six batches on a single tank. The rule of thumb is if your ice is too wet it needs more time and that your water might be too warm. Overall, I was pleasantly pleased by the performance of the ice maker.
Lastly, I would like to mention that the ice maker will require some cleaning to keep your machine running at optimal level. Specifically, the ice maker should be cleaned at least once a week or every three days if you are running it constantly. In addition, the internal pump will alert you that once it has reached a minimum of forty hours of operation time, the self cleaning cycle will needs to be completed. In addition to cleaning, you can also manually clean the evaporator grill; it is recommended you can use lemon water and a damp cloth. Also, be sure that for storage purposes, you wipe down and drain all remaining water using the pump valve located at the bottom of the unit. This is especially important if you will not be making ice on a consistent basis.
In conclusion, the Insignia Ice maker is an excellent option for anyone who needs a portable ice maker. It accomplishes everything it was designed to do in an elegant and stylish package. I was extremely impressed with the quality of the ice cubes and the relatively short amount of time it was able to create one batch of ice. The thickness setting seemingly works as intended, allowing you to adjust the time needed to improve the shape and texture of your ice cubes. As such, I could not find anything negative with regards to the latest insignia ice maker. With that said, the Insignia Ice maker comes highly recommended.
In conclusion, the Insignia Ice maker is an excellent option for anyone who needs a portable ice maker. It accomplishes everything it was designed to do in an elegant and stylish package. I was extremely impressed with the quality of the ice cubes and the relatively short amount of time it was able to create one batch of ice. The thickness setting seemingly works as intended, allowing you to adjust the time needed to improve the shape and texture of your ice cubes. As such, I could not find anything negative with regards to the latest insignia ice maker. With that said, the Insignia Ice maker comes highly recommended.
I would recommend this to a friend!
Share this review:
+2points
2of 2voted this as helpful.
Valuable Gen4 performance is here. Introducing the Crucial P3 Plus Gen4 NVMe SSD, delivering impressive speed with sequential reads/writes up to 5000/4200MB/s1 while providing data protection for optimal security. Engineered by Micron with the latest Gen4 NVMe technology, the Crucial P3 Plus comes in generous capacities2 and offers flexible backward compatibility for most Gen3 systems.
Customer Rating

5
Budget Friendly PCIe 4.0 Storage!
on August 13, 2022
Posted by: Dragonhunter281
As storage solutions continue to evolve, and as PCIe 4.0 compatible drives continue to increase in prevalence, there will always be a necessity for drives to satisfy both performance and budget aspects. Ironically, despite PCIe 4.0 drives being fairly popular, some laptops are still shipping with PCIe 3.0 drives that do not fully take advantage of the hardware. As such, I was excited to try out the latest edition to Crucial’s SSD family: the P3 Plus. Following the launch of last year’s ever popular P5 Plus, the P3 Plus attempts to provide the benefit of PCIe 4.0 at a slightly lower price range. Thus, I was curious to see how the new drive performs as an upgrade option to replace a slower PCIe 3.0 drive.
Upon preparing your laptop or desktop for the upgrade, the process should be fairly straightforward. The P3 Plus ships with a screw just in case your device does not have one. Moving on to my benchmarks, I decided to use my Dell XPS 9305 13’’ laptop that shipped with a KIOXIA 512 GB M2 NVMe PCIe 3.0 drive (Model: KXG60ZNV512G). It is also noteworthy that the 2 TB version of the P3 Plus is a single sided PCB. For monitoring, I used a combination of software including CrystalDisk 8.0.4b, HW Monitor 1.46, and HW Info 7.26. In addition, I also transferred several types of data sizes to reflect the varying degree of the SSD. As such, I used my WD My Passport 1 TB external SSD as the source drive (Model: WDBAGF0010BBL-WESN). Lastly, I do want to mention that the data presented here may differ slightly to what you will experience due to the wide range of variables that naturally occurs with chipsets.
Once the OS was finished installing, I immediately ran CrystalMark 8.0.4b and noted the following results:
Sequential Read Q8T1: 5,005.97 MB/s / Sequential Write Q8T1: 4,339.29 MB/s
Sequential Read 4K Q1T1: 59.18 MB/s / Sequential Write 4K Q1T: 195.09 MB/s
As you can see, the P3 Plus was impressive at the start, easily reaching the advertised speeds of 5000 MB/s read and 4200 MB/s write. Now compare this to the KIOXIA drive that shipped with the laptop:
Sequential Read Q8T1: 3,257.72 MB/s / Sequential Write Q8T1: 2,848.19 MB/s
Sequential Read 4K Q1T1: 55.05 MB/s / Sequential Write 4K Q1T: 154.22 MB/s
Moving on to my first transfer to the P3, I sent my large 32.6 GB music folder that houses 5,783 files and 1,244 folders. While this isn’t an overly aggressive transfer, it does give a general idea of what to expect with regards to the 4K write performance as noted above. Once I began the transfer, the speed gradually increased. After a few seconds, the rate exploded upwards to 650 MB/s and then eventually settled around the 560-590 MB/s range. There was a slight dip to around 530, but it quickly rebounded and settled in the 563-570 MB/s range for rest of the duration. The transfer finished at a blistering 63 seconds! Connectively, this same transfer on the KIOXIA drive slowly climbed to 630 MB/s and held there for a few seconds before settling back to the 500-530 MB/s range. Furthermore, I noticed some occasional spikes between 540-550 MB/s range. When the transfer was close to finishing, there were periods where it dropped to around 470 MB/s. As such, there seemed to be less consistency with the KIOXIA drive. The transfer finished in 70 seconds.
On my second transfer, I sent a 28 GB M2TS movie file to the desktop. Immediately, the transfer began at an insane 835 MB/s and steadily worked its way down to around 805 MB/s. There was a slight dip to around 780-795 MB/s. The huge transfer was finished in a mere 36 seconds! Next, I copied the same movie file but this time included another 40 GB movie file for a total of 68 GB. Interestingly, the rate started around 850 MB/s and held consistently for a bit until it decreased slightly to 810-830 MB/s; eventually it settled to 780-800 MB/s. The transfer finished in 86 seconds. Switching to KIOXIA drive, for both movie files, the drive started around 830 MB/s. It slightly increased to 840-850 MB/s and finished in 87 seconds. For the single 28 GB file, the KIOXIA mimicked the P3 Plus give or take and finished at 37 seconds. Both drives were fairly close to each other with both movie transfers. With these results, however, I do want to caution you that upon several repeated transfers and restarts, the behavior of both drives did vary to a degree. Occasionally, both drives would clear their cache at random points during the transfers causing dips to around 400-500 MB/s depending on where this would occur. Specifically, on the P3 Plus, I tried to pinpoint at what size this would happen but I could not locate it; at some instances it would dip after 95 GB had copied and other times I noted it well after 150 GB. Additionally, the speed at which it dips also varied: one time I noted 400 MB/s and another time it was less severe at 533 MB/s. Naturally, this is not a disadvantage by any means, as many other drives exhibit this same cache flushing behavior once it fills. Nonetheless, this was necessary to mention as at some point you will likely notice this at one time or another. In any event, the P3 Plus was quite impressive during the transfers.
One of the drawbacks to PCIe 4.0 drives, while extremely fast, was the operating temperatures. Thus, it is no secret that some of the top performing drives now include models with pre-attached heatsinks. For laptops, however, the downside is that some heatsinks may not fit given the lack of space. Accordingly, it may also explain why some laptops still ship with PCIe 3.0 drives as typically they will operate cooler; aside from the obvious cost saving benefits. Naturally, though I was curious to see exactly how the P3 Plus will handle a thermally restricted environment. I should note, however, that upon opening my Dell XPS 9305 laptop, the SSD sits under a bracket with a thermal pad. As such, this will improve heat dissipation giving it an advantage that others may not have since all laptops vary. Thus, I decided to test the drive with both scenarios: with the bracket installed and without it. For this test, the laptop was turned off completely and left to cool overnight. Additionally, the laptop was connected with its AC adapter. Immediately on first boot, the P3 Plus was at a chilly 26 degrees Celsius. After sitting for 5 minutes, the drive had risen to 31 Celsius, but decreased back down to 28 degrees. As I browsed the internet, the drive warmed up slightly to around 41-44 Celsius. Once I closed my browser, the drive cooled to 34 Celsius after sitting idle for 3 minutes. During the Crystalmark test, the P3 Plus increased to an astounding 59 Celsius. Once finished, it rapidly cooled to 49. This was absolutely amazing as most drives will swelter to at least 70 degrees or higher during this test. Next, while transferring the two movie files, I noticed the drive held firmly around 54 Celsius. Lastly, during the music folder test, the P3 plus managed to touch 57 Celsius during the transfer. It eventually cooled to 36 Celsius after roughly 3 minutes. Overall, I was extremely impressed as not only are you getting really faster transfers, but there wasn’t a single thermal issue.
My last test was to see if there was any noticeable difference with the SSD bracket removed. I went ahead and let the machine cool off for two hours. Similar to before, I saw 26 Celsius as soon as the computer finished booting. After a few seconds, the P3 warmed slightly to 29 degrees. Next, I proceed with another pass with CrystalMark. As before, the temperature increased gradually; contrary to what you would expect. As the read portion of the test ended, the P3 plus was still at 49 Celsius. Once the write portion began, the P3 plus then quickly increased to 53 degrees Celsius then eventually it touched 59 Celsius. A few seconds later it inched up to 62 degrees Celsius. Considering the limited space and airflow, this was exceptional. Before transferring my music folder, I waited until the drive throttled down to 39 degrees. Once again, the increase in temperature was slow; by the time the transfer was done, the P3 Plus was at a paltry 52 degrees. Lastly, I transferred my two movie files before the drive could throttle. It warmed slightly to 56 degrees before it finished. To conclude, the bracket that came with my laptop seemed to help minimally; at most, roughly 2-3 degrees depending upon the task or transfer. Surprisingly, even with the bracket off, the P3 Plus still cooled to 36 degrees Celsius as it did with the bracket installed. Overall, the P3 Plus has the best thermals I have personally seen on a PCIe 4.0 express rated drive!
In conclusion, the P3 Plus SSD is a fabulous storage solution that deserves some worthwhile attention before your next upgrade. The P3 Plus was able to slightly exceed both its rated read and write speeds as well as provide some impressive transfers. However, despite the cache fluctuation I noticed on one of my transfers, the P3 Plus quickly rebounded and increased back to its normal speed. Additionally, the P3 Plus exhibited some of the best thermal readings I have ever seen for any drive that I have tested; never once did the P3 exceed 62 degrees Celsius! As such, this would be a perfect storage upgrade for any laptop or desktop, provided that you are content its limitations beforehand. While the P3 Plus does not break any performance records, it should still be highly considered: it is still faster than any PCIe 3.0 drive and it does so without the extreme temperatures. Thus, the P3 Plus comes highly recommended.
I would recommend this to a friend!


Share this review:
+11points
11of 11voted this as helpful.
Introducing Alienware x14 R1 - our thinnest 14" gaming laptop features Type-C charging ports, exceptional battery life and a dual-torque hinge design that brings new levels of mobility to everything you do. Experience greater freedom and more productivity with high-performance 12th Gen Intel® Core™ processors. Enjoy smooth gameplay and optimized battery life with the first 14" gaming laptop in the world to offer NVIDIA®G-SYNC® and Advanced Optimus.
Customer Rating
5
Ultimate Portable Gaming!!!
on August 7, 2022
Posted by: Dragonhunter281
.
While CPUs and GPUs are always drastically improving, gaming laptops, in particular, still carry the stigma of being too bulky or heavy. As such, the concept of portable gaming still causes some reproach, proving just how long it has taken to have proper lightweight options without thermal issues. Thus, the Alienware X14 R1 Gaming Laptop aims to provide a gaming experience without sacrificing portability. With the latest 12th Generation i7-12700H, an Nvidia GeForce RTX 3060 GPU, I was extremely excited to test the all new slim X14!
While CPUs and GPUs are always drastically improving, gaming laptops, in particular, still carry the stigma of being too bulky or heavy. As such, the concept of portable gaming still causes some reproach, proving just how long it has taken to have proper lightweight options without thermal issues. Thus, the Alienware X14 R1 Gaming Laptop aims to provide a gaming experience without sacrificing portability. With the latest 12th Generation i7-12700H, an Nvidia GeForce RTX 3060 GPU, I was extremely excited to test the all new slim X14!
Once opened, I was greeted by a sleek looking clamshell box with the famous alien logo on the outside. This was quite surprising! Once you unfold it, the X14 sits in all its glory! While inspecting the x14, the unit screams quality. The X14 clocks in at just 4 pounds and is fairly lightweight. The texture of the lid has a nice smooth finish and is of high quality. As for the dimensions, the X14 is fairly compact, more so than I was expecting. It is roughly about a foot in depth at 12.66 inches, 10.35 inches wide, and only 0.56 inches thick. It is impressively thin! As for connectivity, all of the ports are located at the rear of the unit. Going from left to right, you will note two thunderbolt 4 ports, one micro SD card slot, a USB 3.2 Gen 1 Type-A port, an HDMI 2.1 port, a 3.5mm jack, and a USB 3.2 Gen 2 Type-C port with DisplayPort capability. I believe most will be content with the port options, though I really wish there was an Ethernet jack and one more USB Type-A port. For the display, we have a 14’’ FHD 1920x1080 at 144Hz. HW Info lists it as a Sharp Model LQ140M1. Additionally, in typical Alienware fashion, the backlights on the alien logo and keyboard can both be customized to your preference. However, the section near the ports does not light up as on other models. Lastly, the X14 ships with a 130W USB Type-C charger.
Before we begin the benchmarks, I wanted to test the X14 without making any drastic changes so I could accurately reflect an out of the box experience. However, I did make a few changes; most notably I disabled hibernation and sleep modes. I also disabled all startup executables in the startup tab of task manager except for the Intel Graphics. Furthermore, I disabled the UEFI Firmware Capsule option within the BIOS to prevent Windows Update from updating the firmware. Lastly, I let Windows Update finish all of its updates before proceeding. For the windows power setting, I changed the Power Mode to Best Performance. Connectively, I also set the thermal profile in the Alienware command center to performance. For monitoring, I used a combination of various programs including: HW Info 7.26, HW Monitor 1.46, and Fraps 3.59. All benchmarks were completed while the laptop was connected via its 130 watt power adapter.
On Crysis 3, I set the system preset and texture quality to very high. I disabled motion blur and V-Sync, and set the anti-aliasing to MSAA 2x. As the game begins, it immediately opens up around 60-67 FPS. Once you proceed to move to the bridge, the fps slightly increases to the low 70s. Before you make it inside the ship, there was one slight hiccup into the 40s. I could reproduce this same dip by back tracking to same point on the stairs. Once inside, I noted occasional increases into the 100s, but most of the time you will note anywhere from the 60-90 range. I did notice two sections where the frame rate once again dipped to the 40s, though as before I could replicate it by backtracking to the same point. Supplemental to this, if I increased the MSAA to 8x, the FPS range would decrease to the lower 50s and max out at around 80 FPS. While not extremely taxing, I still found 2x to be the sweet spot for image quality and performance. Interestingly, while playing at 2x the GPU was using around 1.3-1.5 GB of video RAM. Once you increase the MSAA to 8x, the RAM usage increased to 1.9 GB. Connectively, the temperatures on the GPU were around 68-71 Celsius, with the hottest GPU point touching 75c. Considering the workload, I was extremely shocked at how phenomenal the GPU temps were. As for the CPU, I noted that the CPU package would stay around 75-90 Celsius. Another interesting observation was that while playing, much of the CPU load was concentrated on the P-Cores as expected (roughly 25-50% usage). However, the E-cores would occasionally spike to around 15%, but for the majority of the time the cores stayed between 0-5%. The total CPU package load was around 22%. The P-Cores seemed to sustain around the 3.2 – 4.0 GHz range. As for power, the total system power consumption would hover consistently around 100 watts, with 30-50 watts of it being strictly from the CPU. This amount of performance and efficiency is quite mind blowing.
For my second game, I loaded Rise of the Tomb Raider. I set the quality preset to very high. In addition, I set shadow quality, sun soft shadows, pure hair, and specular reflection quality all to very high. I disabled motion blur, film grain, Nvidia DLSS, and V-Sync. Lastly, the anti-aliasing was set to SSAA 2x. As the game began, I noted my FPS of around 60-64. As soon as the weather effects kicked in, there was a small drop to 57 FPS. Once you start walking, the frame rate jumps dramatically depending upon which direction you are looking at. As soon as the mountain gives way, I dipped sharply to 49 FPS. After surviving the outside elements, the FPS jumps slightly to around 70-75 inside the cave. If you increase SSAA to 4x, the FPS drastically tanks another 15-20 FPS; now consistently holding in the mid to low 40s. When the mountain gives way, the lowest point was 35 fps. If you decrease the SSAA 4x to FXAA, the overall increase in FPS is anywhere from 40-70 fps depending upon where you are. The GPU RAM usage on 2X SSAA was around 3.5 GB; at 4x, the RAM usage jumps to around 4.1-5.8 GB. Overall, the game runs incredibly smooth, though I would completely avoid SSAA 4x as the drastic performance loss is not worth it. Lastly, I recommend using the in-game benchmark as it will quickly help you tweak a setting or two to narrow down the performance to your liking.
The last game I wanted to test was Doom 2016. For my settings, everything was set to ultra. I set the motion blur to low, film grain to 0, and disabled V-Sync. The anti-aliasing was set to TSAA 8x. Additionally, I turned the in-game performance metrics to nightmare. As soon as my single player game loaded, the frame rate exploded between 180-200 fps. Once the action heats up, the lowest I saw was around 122 fps. Additionally, all latency metrics for the CPU and GPU averaged around 3.0-6.4 milliseconds. Similarly to Crysis 3, the P-Cores were handling much of the workload, though interestingly the E-Cores were holding around 15-30% in usage. Lastly, the GPU was using around 2.8-3.0 GB of video RAM. Overall, the X14 absolutely chews Doom 2016 and spits it out. I am confident everyone else will be pleased with the results.
Aside from gaming performance, I wanted to run some additional benchmarks. I ran Cinebench R23 for various recent CPUs to give you a general idea of where the i7-12700H stands with the competition. Overall, the chip just crushes during my test; however do keep in mind that the results here will not necessarily reflect across other workloads and/or benchmarks.
I7-12700H - Single: 1,761/ Multi: 15,901 (14 Cores / 20 Threads)
I7- 1280P - Single: 1,706 / Multi: 12,725 (14 Cores / 20 Threads)
Ryzen 7 6850U - Single: 1,530 / Multi: 12,582 (8 Cores / 16 Threads)
Ryzen 7 5800H - Single: 1,381 / Multi: 11,969 (8 Cores / 16 Threads)
Additionally, I also benched each CPU using CPU-Z 2.01. The results are found below
I7-12700H - Single: 731.0/ Multi: 7,844.7
I7- 1280P - Single: 717.7 / Multi: 6,697.2
Ryzen 7 6850U - Single: 631.7 / Multi: 5,812.8
Ryzen 7 5800H - Single: 590.0 / Multi: 5,640.0
In addition to the CPU, I wanted to test the storage capabilities as well. According to HW Info, the X14 ships with a Samsung PM9A1 SSD. Using CrystalMark 8.0.4b, the results are as follows.
Sequential Read Q8T1: 6,822.74 MB/s / Sequential Write Q8T1: 5,077.17 MB/s
Sequential Read 4K Q1T1: 83.36 MB/s / Sequential Write 4K Q1T: 185.52 MB/s
Sequential Read 4K Q1T1: 83.36 MB/s / Sequential Write 4K Q1T: 185.52 MB/s
Next, I wanted to run a quick video encode using my 28 GB M2TS file. Using Handbrake 1.51, I ran the 90 minute using the Very Fast 1080P preset. I set the FPS to match the source as well as pass through the original DTS-MA 7.1 audio. While encoding, the P-Cores naturally down throttled to around 2.6-2.8 GHz. The E-Cores sat around 2.3-2.4 GHz. The CPU package consumed anywhere from 56-80 watts during the task.
I7-12700H - 11 minutes 28 seconds / Avg FPS: 199.0
Ryzen 7 5800H - 17 Minutes 35 Seconds / Avg FPS: 129.4
In conclusion, the Alienware X14 is an absolute stunner in every way. It combines a sleek looking package with modern hardware to handle everything you throw at it. It is compact and light enough to be more portable than other gaming laptops. The build quality is definitely top notch. Furthermore, the thermals were handled exceptionally well given its size and the hardware involved. The i7-12700H is an absolute beast, clocking in at almost 16,000 points on Cinebench as well as compressing a 90 minute movie in less than 12 minutes. Furthermore, the RTX 3060 has plenty of power to run everything at 1080p completely maxed out. Although some may have preferred the option of a higher resolution screen, other problems would have risen: the GPU would have had to be upgraded to power the higher resolution, which in turn equals more heat that its current dimensions may not have allowed to properly dissipate. Nonetheless, at its current configuration it is more than capable. With that said, the X14 performs exactly as intended. Thus, the x14 comes highly recommended.
I would recommend this to a friend!


Share this review:
+11points
11of 11voted this as helpful.
Are you ready for next-gen performance? The Crucial P5 Plus SSD delivers remarkable speed and data protection with sequential reads up to 6600MB/s1 for transformative computing. Engineered by Micron with the latest Gen4 NVMe technology, the Crucial P5 Plus includes advanced features like full hardware-based encryption, dynamic write acceleration, and adaptive thermal protection to keep your data safe while enhancing system reliability. Designed specifically for intensive workloads, high-quality creative content, and hardcore gaming, the P5 Plus is also backward compatible with most Gen3 systems for ultimate flexibility. The Crucial P5 Plus meets the performance and form factor requirements for Sony PS5 when used with a heat sink; heat sink sold separately.
Customer Rating
5
Blazing Fast PCIe 4.0!
on September 3, 2021
Posted by: Dragonhunter281
As a computer enthusiast, storage is one of the most important components one can choose for their computer; often such decisions are based on price and the performance of the drive. As such, most would certainly agree that Crucial is certainly synonymous in both aspects. As an owner of several of their SSDs, dating back to the M4 as well as various memory kits from the early 2000s, Crucial has proven reliable over many years. With the announcement of the P5 Plus, Crucial attempts to provide you with a cost effective way to enjoy blazing PCIe 4.0 speeds. Thus, I was eager to test the new P5 plus with some real world scenarios, as well as comparing the original P5.
As I am sure most are already aware, the M2 drive installation is fairly straightforward. However, I was surprised to find that Crucial included a screw inside the box, as my original P5 and P1 did not come with one. For my tests, I wanted to showcase a variety of scenarios that will provide you with an idea of what to expect. For software, I used Crystalmark 8.0.4 to benchmark the drive. I also used Crystal Disk Info 8.12.6 and HW Monitor 1.44 to monitor temperatures during all of my transfers. I will start with the PCIe 4.0 tests as I am sure that is what most are looking forward to. The P5 was installed on an MSI X570 Pro- A Motherboard coupled with a Ryzen 3900x. In addition, I used my WD My Passport SSD 1TB (Model: WDBAGF0010BBL-WESN) to transfer a bluray image to the P5 then back to the external. Furthermore, I repeated the same process but instead, to test the 4K performance, I transferred a 31.6 GB music folder that holds 5,595 files and 1,193 folders. I will put the full results of all my data in the screenshots. Lastly, keep in mind that your results will differ here. You may or may not exceed my results. Nevertheless, here are the results on PCIe 4.0:
Sequential Read Q8T1: 6,830.71 MB/s / Sequential Write Q8T1: 4,962.82 MB/s
Sequential Read 4K Q1T1: 67.67 MB/s / Sequential Write 4K Q1T: 163.66 MB/s
As you can see, the results are pretty staggering. During the benchmark, the drive temperature held around 70-75C. Next I began my manual transfer tests by sending a 37 GB bluray ISO image to the P5 plus and immediately noted a scorching 828 MB/s! The transfer held consistently with small spikes of 2-3 MB/s. It hit a peak of 830 MB/s. In addition, I watched temperature range from 60-64c during the transfer. Once completed, the drive quickly settled back down to 50c. The transfer took 38 seconds. Next, I sent the bluray image back to the WD drive where I noted 562-563 MB/s. The transfer rate once again fluctuated by 2-3 MB/s. Much like the previous test, this transfer was extremely consistent. The transfer completed in 50 seconds. Switching transfers, I sent my music folder to the P5, with a smoking range of 610-620 MB/s! As before, the speed adjusted back and forth between 560-570 MB/s. I noted a peak of 661 MB/s, but the bulk of the transfer was mostly in the 580-620 MB/s range. The transfer finished in about 1 minute with a peak temperature reading of 64c. Lastly, that same transfer was sent back to the WD SSD with a much more varied range of 330-470 MB/s. However, eventually it settled in the 370-390 MB/s range for most of the transfer with a peak of 450 MB/s. The transfer took roughly 1 minute and 30 seconds. The P5 plus touched 68c during this last transfer. Overall, the P5 plus was smoking fast and did not disappoint.
In addition to the blazing PCIe 4.0 performance, I next wanted to shift to a mobile environment by using a current generation laptop. Initially, I was going to test the P5 Plus PCIe 4.0 performance by using my Asus Q538 flipbook that houses an Intel 11th Generation i7-1165 G7. However, that quickly failed through as two things were discovered. First, the 11th generation CPU enables an enterprise feature called VMD, which allows the CPU to lock the NVMe to its controller. Essentially, this ties back to a feature found on Xeon chips called VROC. Second, Asus had locked my laptop to this exclusive RAID mode which prevented me from switching to the standard AHCI mode. Furthermore, the M2 slot was capped at PCIe 3.0, despite the CPU supporting PCIe 4.0. Thus, it is important to note this as each manufacturer will implement something different. I have seen other 11th generation laptops that allow you to switch back AHCI, but I was not able to test those to see if their M2 slot was locked to the 3.0 lanes like mine was. In any event, even if I could switch back to AHCI, this does not guarantee that I would be able access PCIe 4.0. So to conclude, I want to caution you that PCIe 4.0 on laptops is still in its infancy and may not be fully implemented yet. Aside from this, my Asus laptop did feature two Thunderbolt 40 Gbps ports so I decided to repeat the same transfers I did above to see how the P5 Plus handled being capped on 3.0. Here are my Crystalmark 8.0.4 results:
Sequential Read Q8T1: 3,391.01 MB/s / Sequential Write Q8T1: 3,326.09 MB/s
Sequential Read 4K Q1T1: 42.55 MB/s / Sequential Write 4K Q1T: 104.55 MB/s
As with my manual transfers from before, I started with the bluray image. The transfer began immediately, sustaining an impressive 849-850 MB/s! It was able to peak to 857 MB/s before it worked its way back down to 850 MB/s. As from before, I noted small 2-3 MB/s variations on the transfer rate. Once again, I was blown away. The transfer finished 37.3 GB in 35 seconds! While the 4.0 test was just a smidge slower, a repeated test could have exhibited faster results as they were well within the margin of error. Nonetheless, I was still impressed. Moving on, the same test back to my WD SSD held just as consistently, though a bit slower at 669-674 MB/s. As expected, the transfer took slightly longer, but still completed the task around 45-50 seconds. Next, I sent my music folder to the P5 plus. The transfer took a bit to build up in speed but soon it was able to reach 600 MB/s. I noted a peak of 631 MB/s. However, as the transfer prolonged, it fluctuated a bit in the 580-620 MB/s range. The transfer finished in about one minute. Lastly, I sent the music folder back to my WD external. This was the slowest out of all my tests, but eventually the transfer worked its way up to around 400 MB/s. However, I noted a larger transfer range of 299-510 MB/s, with averages around 340 MB/s. Naturally, the transfer took a bit longer to finish due to its more varied nature, but still the task was completed in a respectable 1 minute 45 seconds. As expected, the overall performance of the P5 plus is sure to impress. Even on PCIe 3.0, the results are quite exhilarating.
For my last test, I wanted to compare both the P5 Plus and original P5 using the same laptop and I also wanted to mentioned some interesting temperature data. For this test, I will be using my HP X360 Envy laptop that I used with my original P5. This laptop houses a Ryzen 2500U CPU. First and foremost, here are my benchmark results for both drives. I also included my P2 results for comparison:
P5 PLUS: Sequential Read Q8T1: 3,245.79 MB/s / Sequential Write Q8T1: 3,106.11 MB/s
P5 PLUS: Sequential Read 4K Q1T1: 55.67 MB/s / Sequential Write 4K Q1T: 116.00 MB/s
P5 REG: Sequential Read Q8T1: 3,104.70 MB/s / Sequential Write Q8T1: 3,033.43 MB/s
P5 REG: Sequential Read 4K Q1T1: 55.10 MB/s / Sequential Write 4K Q1T: 126.56 MB/s
P2: Sequential Read Q8T1: 2,033.12 MB/s / Sequential Write Q8T1: 1,678.48 MB/s
P2: Sequential Read 4K Q1T1: 56.55 MB/s / Sequential Write 4K Q1T: 125.85 MB/s
P2: Sequential Read 4K Q1T1: 56.55 MB/s / Sequential Write 4K Q1T: 125.85 MB/s
As expected, both P5's are fairly equal to each other, though the P5 plus was able to squeeze just a little bit more performance. Furthermore, I expected the thermals to also reflect similar results, but I was in for quite shocked. Starting with the original P5, upon windows boot, the drive registered between 48-52c. It dropped slightly down to 44c after letting it sit there for ten minutes. I ran Crystalmark and the drive rocketed to 63-69C range. Once finished, the drive settled down to 47c. Connectively, the P5 plus completely shocked me. Once the laptop booted windows, the P5 Plus registered 37-40c instead of the typical 48-52c as I had noted on the original P5. After ten minutes, the P5 plus was able to cool itself to an astonishing 30c! Thus, the P5 plus was idling 15-20c cooler than the previous P5! I ran Crystalmark on the new P5 plus and was able to reach 60c-66c. After the benchmark finished, the P5 plus temperature dropped drastically down to 42c and then eventually back down to 30c. In addition, I could physically feel the heat difference between both drives by placing my hand on the bottom of the laptop. It was a revelation to say the least, especially given their equivalent performance.
In conclusion, the P5 Plus is a comprehensive NVMe solution that will certainly entice those who are looking for a new SSD. With PCIe 4.0 support, the P5 plus drive will provide you with blazing fast transfers at a reasonable price. I was able to exceed the rated read speed by a pretty decent margin. In addition, the drive was able to handle both sequential and 4K transfers with little effort, even when limited to PCIe 3.0. Even if you are still stuck on PCIe 3.0, the P5 plus proves it could be an affordable future proofing solution. Once you upgrade to PCIe 4.0, you will already have a drive ready to go. Lastly, I was completely blown away at the temperature differences between my original P5 and the new P5 plus. Overall, the Crucial P5 Plus is an exciting upgrade solution for any laptop or desktop. Thus, the new Crucial P5 Plus comes highly recommended.
In conclusion, the P5 Plus is a comprehensive NVMe solution that will certainly entice those who are looking for a new SSD. With PCIe 4.0 support, the P5 plus drive will provide you with blazing fast transfers at a reasonable price. I was able to exceed the rated read speed by a pretty decent margin. In addition, the drive was able to handle both sequential and 4K transfers with little effort, even when limited to PCIe 3.0. Even if you are still stuck on PCIe 3.0, the P5 plus proves it could be an affordable future proofing solution. Once you upgrade to PCIe 4.0, you will already have a drive ready to go. Lastly, I was completely blown away at the temperature differences between my original P5 and the new P5 plus. Overall, the Crucial P5 Plus is an exciting upgrade solution for any laptop or desktop. Thus, the new Crucial P5 Plus comes highly recommended.
Mobile Submission: False
I would recommend this to a friend!


Share this review:
+8points
8of 8voted this as helpful.
The ARRIS SURFboard mAX AX6600 Tri-band Wi-Fi 6 Mesh System (Model W121) delivers faster speeds, greater coverage, and expanded capacity to your home network. With speeds up to 6,600 Mbps per unit and coverage up to 5,500 square feet per system, it provides more speed and coverage then most 3-unit systems. mAXimize your Wi-Fi with the ARRIS SURFboard mAX Wi-Fi 6 Mesh System.

Posted by: Dragonhunter281
In recent years, the ubiquitous mesh system has seemingly gained in popularity, promising improved range, easy setup, and faster networking. Furthermore, the ability improve your network signal by adding additional units is certainly attractive. As such, with the advent of 802.11AX, or Wi-Fi 6 for short, I was certainly excited to test Arris Surfboard Max with my recently installed fiber connection. With coverage up to 5500 square feet and speed up to 6,600 Mbps, I was certainly looking forward to comparing this with my other mesh system, the Orbi AC3000.
While setting up the Surfboard Max should be relatively straightforward as with other mesh systems, there were some notable observations. At the start of the setup wizard, the application will ask you to pick the scenario that best represents your system. For my system, I went ahead and chose the fiber based modem and gateway option. In addition, it will ask to optimize the placement of the satellite, but I declined and opt for manual install. While it searched for the device, I did have one instance of it failing, but it was successful after I clicked try again, though please note this process took a few minutes. Also, you will notice an SSID called Surfboard On-Boarding listed on your Wi-Fi devices. You may have to connect to that manually if it won’t find it automatically. Finally, once your account is completed and your SSID has been successfully updated, along with the password, you will be taken to the home page. It will also update your firmware accordingly. Once your satellite is installed, the application will ask you to optimize the connection. After completion and taping on the router, I was glad that you can see what part of the system your devices are connected to. For example, when I moved upstairs, I saw my laptop switch to the satellite as opposed to the main router. I also got see what particular band my device was connected to, rather if it was 5 GHz or 2.4 GHz. On the application, when you tap on either the satellite or main router, you can control the LED brightness or you have the ability to restart that unit. You can also edit the name of each unit. Additionally, the main system settings can be found if you tap network at the bottom, then touch the plus sign by network settings. You will then note three options: General, WLAN, and LAN. Under general settings, you can disable UPNP, enable bridge mode, or set up port forwarding. Under WLAN settings, you have WAN IP Configuration or DNS configuration. Lastly, taping LAN setting allows you to set IP reservation, configure the subnet and DHCP range, and DHCP lease time. Comparatively, the Surfboard did have more internet settings than the Orbi system, though compared to standard routers, your settings are still relatively limited. I still would have liked the ability to control the channels, such as enabling or disabling the 5 GHz or 2.4 GHz band or have the ability to split them. Fortunately, it did seem that all the devices that were 5 GHz compatible all connected that way. Connectively, the Orbi did have more testing features such signal tests that you can do per room as well as see a list of all the routers nearby and their respective channels. There was also a signal meter that I could use in real time that the Surfboard Max does not have. In addition, the Orbi also had more physical ports than the Surfboard. The Orbi router had three additional Ethernet ports and the satellite had four. Lastly, my last observation was that the Surfboard application requires you to have location services enabled, even after setup, which I did not like. The Orbi application did not require it. After testing both systems, I still wished they had provided an alternative setup method without using a smartphone. Overall, both applications do seemed to work, despite their limited design.
Given the nature of networks, and certainly the varying degree in which they operate, I wanted to at least provide you with an idea of what you might expect. In addition, there are a number of factors that will contribute to the overall performance of any networking system. As such, it should not come to the surprise to anyone that my results will not be reflected on your end. Even with repeated tests, there were instances of inconsistency due to the nature of networks. With that said, I used two different laptops, each with a different internal wireless adapter. I had each computer plugged in with their respective adapters, with the power options set to maximum performance. I also did not modify any adapter settings. In addition, I placed my Orbi in the same exact place where my Arris was, but I disconnected the Surfboard before proceeding. I should also note that the Orbi is limited by the 802.11ac standard so it does not have Wi-Fi 6 capability, though it is still fast enough to be included. Connectively, each of my speed measurements were taken in same room as the router and the furthest room away from the main unit. The satellite was placed upstairs about half way in the middle of the house. Lastly, I monitored the speed a 60 GB download on the Surfboard Max in each room.
For my first test, I used my HP Envy from 2017 that houses a Realtek RTL8822 802.11ac wireless card. I used the web based Speedtest for my results. My results are as follows:
HP Surfboard Short Range: 439.38 MB/s DOWN / 556.76 MB/s UP
HP Surfboard Long Range: 322.97 MB/s DOWN /453.49 MB/s UP
HP Surfboard Long Range: 322.97 MB/s DOWN /453.49 MB/s UP
HP Orbi Short Range: 423.79 MB/s DOWN / 449.12 MB/s UP
HP Orbi Long Range: 301.63 MB/s DOWN /106.50 MB/s UP
HP Orbi Long Range: 301.63 MB/s DOWN /106.50 MB/s UP
As one can see, the results were well within range of each other. On the Orbi long range test, I ran several passes to see if the upload speed would improve to no avail. I assumed that it could be server related, though nonetheless this could give you some can idea of what to expect.
For my second test, I used my Asus laptop from last year that is enabled with Wi-Fi 6 connectivity. Inside, the wireless card is listed as an Intel AX201 802.11ax. Once again my results are as follows:
Asus Surfboard Short Range: 515.78 MB/s DOWN / 626.34 MB/s UP
Asus Surfboard Long Range: 230.18 MB/s DOWN /317.25 MB/s UP
Asus Surfboard Long Range: 230.18 MB/s DOWN /317.25 MB/s UP
Asus Orbi Short Range: 373.61 MB/s DOWN / 423.44 MB/s UP
Asus Orbi Long Range: 276.40 MB/s DOWN /298.22 MB/s UP
Asus Orbi Long Range: 276.40 MB/s DOWN /298.22 MB/s UP
As you can see the Surfboard Max did fairly well as it did with my HP. Both systems did naturally degrade in throughput on the long range tests, though that was to be expected. The Asus did score the highest on the Surfboard short range test. Overall, I was fairly pleased with the results. The upload speed on the Orbi long range test did improve a bit compared to my HP. Once again, these results will vary drastically so take them with a grain a salt. Nevertheless, I was still happy with the results.
Switching tests, I monitored the performance of a 60 GB download using the Realtek RTL8822 802.11ac wireless card found inside my HP laptop. As one can imagine, the download did not disappoint. The Surfboard initially began the download around 20 MB/s, and eventually worked its way up to the low to middle 50s. Once it peaked, it hit a blazing 61 MB/s! However, I quickly noticed sudden drops down to the 20-30 MB/s range and eventually it would pause at zero until ramping back up. The culprit was quickly identified that the mechanical drive that I was downloading to held a constant 100% usage across the board and could not maintain the speed necessary to accept a consistent 50-60 MB/s for the whole duration of the download. Moving the download to my SSD, the results were immediately noticeable. I held much more consistent around the 48-53 MB/s range and no longer did I drop back into the 30s. I also noticed that I would hold the upper 50s and low 60s much more frequently. As opposed to my mechanical hard drive, my SSD usage range was a paltry 3-10%. I also hit a peak download of around 65.7 MB/s. Despite the wireless card not having 802.11ax, the performance was still pretty spectacular.
Finally, my last test was using my Asus laptop that houses an Intel AX201 802.11ax wireless card. Connecting to the Surfboard Max, I began my 60 GB download to the SSD. As the download began, the Intel AX201 flexed its muscles, clocking around 60 MB/s consistently. Eventually, I was noticed that it was able to sustain up to 69 MB/s much more frequently than my HP. For a couple of minutes, it altered back and forth and never once dropped below 60 MB/s. After a few minutes, the Arris Surfboard Max eventually hit a peak download of 76.8 MB/s. It could hold 70 MB/s or higher for a bit but quickly dropped back into the middle 60s. Overall, the 60 GB download was complete in roughly 25 minutes and was every bit as fast as I expected. It was also interesting to see that both adapters performed similar to each other. Thus, while the AX adapter was faster in spurts, it still averaged similar speeds as my previous adapter. Naturally, it would be misleading for me to say it was faster just by nature of its wireless standard. Nonetheless, the Surfboard Max easily performed to expectations.
In conclusion, the Surfboard Max performed as it was designed to do. It is certainly a viable option for those who are looking to increase the range of their Wi-Fi, especially in large homes. With fairly easy setup, the Surfboard Max integrated nicely with my new fiber connection. As for the application, I was hoping to see more control over wireless settings, though it did have more than the Orbi. I was also not a fan of requiring location services, even after the initial setup. As for performance, the results were pretty exciting. Every download was blazing fast on any device I had connected to it. Everything was instantaneous. Overall, the Surfboard Max is certainly capable of high performance. It maintained the speed of my fiber connection, while extending exceptional range throughout the house. Thus, the Surfboard Max comes recommended.
Mobile Submission: False
I would recommend this to a friend!


Share this review:
+14points
14of 14voted this as helpful.

The Alienware m15 Ryzen Edition R5 gaming laptop is our first laptop powered with AMD Ryzen™ processors and NVIDIA® GeForce RTX™ 30-series graphics.To keep performance prioritized and temperatures under control our Alienware Cryo-tech™ cooling technology helps and is designed to keep gameplay and confidence high. Each gaming experience on the m15 is intended to wow players visually, built around a 15” screen, with refresh rates spanning 165Hz, 240Hz, and 360Hz this new generation of m15s are focused on delivering an uncompromised visual experience. Even the visual ID ha staken a step forward and introduces newly evolved Legend industrial design.
Posted by: Dragonhunter281
As with any laptop or desktop designed for gaming, the CPU and GPU are the two main focal points when determining what model to purchase. It is because of this that I was certainly excited to see how the latest Alienware R5 model performs. The Alienware R5 comes equipped with the latest Ryzen 7 5800H for mobile and is powered by the Nvidia Geforce RTX 3070 to tear through the latest games. Despite some controversy with the GPU implementation, the Ryzen Edition of the m15 still deserves some attention combining a relative sleek looking package, decent hardware, and respectable build quality. Granted, I was curious to see if it can still perform and if it could still be a competitive option.
Once opened, the Alienware m15 Ryzen Edition is much more compact than I thought it would be. Physically, it is not overly obtrusive or thick like some gaming laptops. Immediately one of my favorite features was that most of all the main ports are neatly aligned at the front of the unit. Naturally, this allows you to easily access the USB 3.2 Gen 1 ports on the right and the Ethernet port without other cords blocking your access. Furthermore, there is an additional USB 3.2 Gen 1 port on the front and also a USB 3.2 Gen 2 Type-C port. I was also quite impressed with the style of the laptop. It has a nice smooth brush feel to it and a stylish etched pattern on the top of the display. I was also impressed by the LED light that runs in a loop at the front as well as the iconic alien head LED light. In addition, the keyboard was responsive and was fairly quiet when you typed. Surprisingly, it was actually more comfortable typing on this keyboard than some of our other laptops. Moving on, the 240 HZ 1440p display is insanely gorgeous with excellent clarity and sharpness. HW Info lists the display as an LG model LGD0690. I was pleasantly surprised on how bright it was at max setting. Connectively, the contrast was wonderful throughout and color was exceptionally vibrant. The contrast was especially noticeable when viewing the included Alien desktop wallpaper.
Before we move on to the performance aspects, there were a couple of observations that I would like to mention. First and foremost, I tried to change little as possible with regards to settings in order to maintain the closest out of the box experience that I could. With that said, the main significant change was that all of the drivers and updates were downloaded and installed by the OS. Although not preferable, most will probably let this task finish. Additionally, all of the startup executables were disabled. Connectively, I also disabled the UEFI Capsule setting in the BIOS to prevent it from updating over Windows update automatically. The BIOS should never be updated like a piece of software. Furthermore, I did not alter anything that would reclaim back some of the hard drive space used, even though for some reason Dell's Windows 10 installation already costs you 46 GB immediately upon your first boot of the OS. I was pretty disappointed with this, especially given that they only gave you a 512 GB SSD. You will more than likely need to fresh install to reclaim a good portion of that space back or perhaps upgrade to a bigger capacity. After updates and drivers, it blossomed to 53.6 GB used. Lastly, as most are probably aware, this particular implementation of the 3070 is cut down. GPU-Z shows 4,608 CUDA cores instead of the full 5,120. The TMU count is 144 instead of 160. Unfortunately, this is not ideal and, at the very least, Dell should have mentioned this on the specifications. Hopefully, the full chip can be unlocked via an update to the firmware or BIOS. Nonetheless, I hope this could at least provide some guidance on what to expect during setup.
Before we move on to the performance aspects, there were a couple of observations that I would like to mention. First and foremost, I tried to change little as possible with regards to settings in order to maintain the closest out of the box experience that I could. With that said, the main significant change was that all of the drivers and updates were downloaded and installed by the OS. Although not preferable, most will probably let this task finish. Additionally, all of the startup executables were disabled. Connectively, I also disabled the UEFI Capsule setting in the BIOS to prevent it from updating over Windows update automatically. The BIOS should never be updated like a piece of software. Furthermore, I did not alter anything that would reclaim back some of the hard drive space used, even though for some reason Dell's Windows 10 installation already costs you 46 GB immediately upon your first boot of the OS. I was pretty disappointed with this, especially given that they only gave you a 512 GB SSD. You will more than likely need to fresh install to reclaim a good portion of that space back or perhaps upgrade to a bigger capacity. After updates and drivers, it blossomed to 53.6 GB used. Lastly, as most are probably aware, this particular implementation of the 3070 is cut down. GPU-Z shows 4,608 CUDA cores instead of the full 5,120. The TMU count is 144 instead of 160. Unfortunately, this is not ideal and, at the very least, Dell should have mentioned this on the specifications. Hopefully, the full chip can be unlocked via an update to the firmware or BIOS. Nonetheless, I hope this could at least provide some guidance on what to expect during setup.
As for my performance tests, I tested each of the three of the main components: CPU, GPU, and SSD. For gaming, I tested three games: Rise Of The Tomb Raider (2016), Crysis 3 (2013), and Doom (2016). I used the highest preset in each game, and where film grain and motion blur is an option, I disabled it. Each game ran at the native resolution of 2560x1440. Throughout all of my tests, I monitored thermals with HW Info, HW Monitor, CPU-Z and GPU-Z. I used Fraps to watch the frame rate.
On Rise Of The Tomb Raider, with anti-aliasing set to FXAA (default), as soon as the opening sequence loads, the fps explodes. I was reading anywhere from 88-95 fps walking along the mountain. As soon as the weather kicks in, I dipped to 82 fps. Depending on your camera angle, I noted frame rates up to 130. With the game running, GPU- Z has the 3070 at around 75c. The CPU hit around 83c. Once the mountain gives way, I dipped to the low 70s and shot right back up to the low to middle 90s. Inside the cave, I quickly shot up to 102-105 fps. If you switch the anti-aliasing to SSAA 2x, the story changes. At the start of the game, I noted frame rates from the high 50s to low 60s. Weather effects dips you to the low 50s. Overall, there is about a 20-40 fps decrease between the two anti-aliasing methods. Additionally, even more impressive was that GPU-Z reported the board power draw for the GPU never exceeded 115 watts. The performance was so crazy that I was curious to see how it would compare to my desktop that houses a GTX 1080. With both on the same settings at 1080p, my GTX 1080 notched 91.85 fps and the 3070 hit 100.18 fps.
Crysis 3 should come as no surprise to anyone with its graphic intensity. Using the very high preset and anti-aliasing set to MSAA 8x, I immediately noted anywhere from 50-65 fps. There was an occasional dip but to see this game smooth at 1440p is mind blowing. Once you start fighting, the fps ranges anywhere from 53-65 fps. Cutting anti-aliasing back to MSAA 4x, allows you to stay above 60. I saw one instance of 59 fps, but typical range is 60-75. Finally, once you dial back to MSAA 2x, I never dropped below the 70-85 range, with occasion dips to the mid 60s. I saw one instance of 90+. Overall, this was extremely impressive and it looked absolutely stunning at 1440p. CPU temp hit 95c and the GPU stayed around 75c.
Finally in Doom 2016, I was expecting the same staggering results and I was not disappointed. With all of its settings maxed out and motion blur off, the game literally did not drop below 160 fps and averaged around 170-200 fps. Perhaps the most amazing thing was that when I turned the in game metrics overlay on, the latency between CPU and GPU literally did not go past 3ms. This game was literally chew up and spit out.
Finally in Doom 2016, I was expecting the same staggering results and I was not disappointed. With all of its settings maxed out and motion blur off, the game literally did not drop below 160 fps and averaged around 170-200 fps. Perhaps the most amazing thing was that when I turned the in game metrics overlay on, the latency between CPU and GPU literally did not go past 3ms. This game was literally chew up and spit out.
Aside from the GPU, which is stunning in its own right, the CPU certainly steals the show. The Ryzen 7 5800H just crushes everything that is thrown at it. With eight cores and sixteen threads, and a paltry 45w TDP, this chip just screams at you. Unfortunately, while I did not have a sample of the 11th generation i9 to test this CPU with, I did have an i7-1165 G7 in my ASUS laptop that was at least of this current generation, though please note that the i7 is only four cores and eight threads. For my encode test, I used Handbrake 1.3.3 and encoded a 28 GB M2TS file using the Very Fast 1080p preset. I set the audio to pass through the source. I also set the frame rate to match the source. I disabled two pass encode and removed subtitles and chapters. My results were as follows:
i7-1165 G7: 29 Minutes and 1 second / Ryzen 7 5800H: 16 Minutes and 32 Seconds.
As you can see the Ryzen handles multithreaded tasks very well. As for a single threaded test, I used Musicbee 2.4 to encode a 24 minute WAV file into MP3 using LAME 3.99. I used a constant bit rate of 320 kbps and set the internal algorithm to 0 for the highest quality (-q command). I set the maximum encoding threads to one core. Lastly, I included CPU-Z benchmarks for both processors.
i7-1165 G7: 1 Minute and 14 seconds / Ryzen 7 5800H: 1 Minute and 11 Seconds.
i7-1165 G7 - Single: 563.9 / Multi: 2,698.3 / Ryzen 7 5800H - Single: 581 / Multi: 5,665.
Moving on, I next wanted to give you an idea of the SSD performance. HW info has this listed as a 512 GB Samsung PM991a NVMe running at 4x over PCIe 3.0. While the drive is fairly decent, it will not break any records. While sequential results were alright, the 4K read pretty low. My Crystalmark 8.0.2 results were as follows (see screenshot for full results):
Sequential Read Q8T1: 3,102.99 MB/s / Sequential Write Q8T1: 1,436.26 MB/s
Sequential Read 4K Q1T1: 42.85 MB/s / Sequential Write 4K Q1T: 115.91 MB/s
Supplemental to these results, I manually transferred a 31 GB music folder containing 5,494 files and 1,179 folders from my Samsung T5 over the USB Type C port. The transfer averaged around 415-425 MB/s range and finished in roughly a minute.
In conclusion, the Alienware R5 Ryzen Edition is a solid performer that doesn't fully disappoint despite some who might completely write it off due to the cut down GPU. It is certainly fair to critique such a decision, especially given the price points involved. In addition, I was quite disappointed about the 46 GB bloated Windows installation. However, this does not fully negate what the hardware is still capable of at its current configuration. It still a high performance machine. The Ryzen 5800H is still a monster CPU, taking mobile multitasking capabilities to new high heights. The RTX 3070 still powers through games like they are nothing, even beating my GTX 1080. Furthermore, the 240 Hz 1440p display was absolutely drop dead gorgeous. The keyboard was extremely comfortable and the customizable LEDs are another plus. The laptop itself looks really stylish and has a nice polished feel to it. While there is certainly room for improvement, the Alienware m15 R5 Ryzen Edition deserves at least some consideration. Therefore, the R5 comes recommended only for those are who are content with the above concerns.
Mobile Submission: False
I would recommend this to a friend!


Share this review:
+3points
3of 3voted this as helpful.
The Shark EZ Robot is your easy path to a smart clean. It combines the convenience of a self-empty base with powerful Shark suction for a complete home clean. After each cleaning session, your robot automatically empties itself into the bagless self-empty base, which holds multiple sessions’ worth of dirt and debris so you can forget about vacuuming for weeks. Now that’s easy.
Posted by: Dragonhunter281
As most would certainly attest to, any daily chore requires the right tool when trying to accomplish any task as efficiently as possible. Robot self cleaning vacuum cleaners, in recent times, have seemingly gained in popularity; though as someone who has never used one, I still remained skeptical in their ability to effectively clean. In addition, it is also common to see these cleaners marketed as a complete solution to where you could substitute one in place of your standard vacuum cleaner. As a previous owner of Shark vacuum cleaner, I was curious to test their latest robot self cleaning vacuum cleaner with regards to cleaning performance in a pet environment to see if it could become a viable cleaning option.
Starting with installation, everything was straightforward and pretty standard. To keep with an out of box experience, we followed the quick start guide as most people will start there. Inside the box, you will note the main unit, the self cleaning base, and a hard mat for the dock should you decide to store it on carpet. The robot itself is fairly light at 12 pounds. You will also find two swivel feet that will need to be installed first. For charging, the main unit will require six hours to fully charge, however, ours came pre-charged with about 40% battery. As for setting up the base, you should not have an issue. You will note two blue lights once you have the robot placed correctly: one on the base and one on the unit. Once in place, your cleaner will chime and then engage the self cleaning. Do not be alarmed as this is normal. On the front of the unit, you will find two buttons: Clean and Dock. Additionally, you will note the battery and Wi-Fi indicators on the front of the unit. As for application setup, it all went fairly smooth. We did not have any issue connecting to Wi-Fi. The application prompted for approval to join the network and we were good to go.
Starting with installation, everything was straightforward and pretty standard. To keep with an out of box experience, we followed the quick start guide as most people will start there. Inside the box, you will note the main unit, the self cleaning base, and a hard mat for the dock should you decide to store it on carpet. The robot itself is fairly light at 12 pounds. You will also find two swivel feet that will need to be installed first. For charging, the main unit will require six hours to fully charge, however, ours came pre-charged with about 40% battery. As for setting up the base, you should not have an issue. You will note two blue lights once you have the robot placed correctly: one on the base and one on the unit. Once in place, your cleaner will chime and then engage the self cleaning. Do not be alarmed as this is normal. On the front of the unit, you will find two buttons: Clean and Dock. Additionally, you will note the battery and Wi-Fi indicators on the front of the unit. As for application setup, it all went fairly smooth. We did not have any issue connecting to Wi-Fi. The application prompted for approval to join the network and we were good to go.
As for our testing, it is imperative to note that your results will differ here, though hopefully this can give you an idea on what to expect. Our tests were done in a 2400 square foot home with a large golden retriever that is constantly shedding hair. Therefore, this was the perfect environment to test the cleaning performance. Also certain variables such as house layout and furniture placement will certainly impact your initial results. Furthermore, we ran two tests: one in a mixed environment with hard floors, furniture, and different types of rugs. The second was in the bedroom on carpet. In each setting, the robot was started from its base within that same vicinity. We ran it on continuous mode for roughly 20 minutes each.
On the first test, the robot began in the living room and went immediately straight. It appeared after a pass or two that it was going to clean up and down in a grid pattern, though eventually this was not the case. When it came into contact with the chair legs, it kept having to readjust, but nonetheless it eventually made it around all four. Regardless, I was pleasantly surprised with how well it stopped and swiveled itself whenever it did hit something. The same thing was noted as it went in and out between the rest of the furniture. In the laundry room, it was able to quickly get itself out of a small area between the door and the wall. In areas of high traffic, dog hair was effortlessly vacuumed. As time went on, you could see that the robot was learning the house layout fairly quickly. It did exceptionally well with wall detection and base boards throughout the bottom floor. Once it reached the bathroom, it was able to power itself over a thick woven rug that certainly delighted us. After making a few passes in there, it took a diagonal path out of the bathroom, which was certainly an improvement upon its up and down movements previously. Upon further inspection, this certainly proved to be true. Within the application, there was map of the portion of your house that it had already cleaned. Another feature we noted while cleaning, was that within the application, you can also set the cleaning mode. Default is set to normal. On Economy mode, there was an audible reduction in sound. On maximum, its suction increase. However, it wasn't any louder than a normal vacuum cleaner. There was also no lag in communication between the application and the cleaner, which was a plus. Once we had discovered this option, we left it on maximum. After leaving the robot in continuous mode for 20 minutes, we then called it back to base. Interestingly, the robot then proceeded to retrace its steps back the way came. As it reached the base, it reversed back into the dock and adjusted its alignment accordingly. It was quite exciting to see. Once it detected a charge, the loud cleaning process began. Another feature that we quickly tested afterwards was scheduled cleaning. We had set the cleaning to begin at 8 PM, which began on the dot. I was certainly impressed. We then emptied the cleaning bin, which was quite full of dog hair.
On the second test, we moved the docking station to the bedroom. We sat the docking station on the hard surface mat that came with the cleaner. Once resumed, the robot began cleaning in a straight up and down pattern as before. It did seem to adjust fairly quickly, even though in some small areas, it unintentionally went over areas it had finished previously. Once it reached bathroom, the transition from hard floor to carpet did not seem to faze it. Wads of pet hair were instantly sucked up as it continued on its journey. You could also see streaks in the carpet once it finished a pass that resembled traditional vacuum cleaners. In confined areas, the robot naturally took a bit longer to adjust its way out of it, but nonetheless, it was able to find its way out. As the cleaning progressed, once again the learning seemed to improve over time. Interestingly enough, once we called the robot back to base this time, the robot went directly to it as opposed to retracing its previous path. This was quite something. As before, the amount of hair that was picked up was quite a bit for such a small device. Overall, I was quite pleased with how it performed.
On the second test, we moved the docking station to the bedroom. We sat the docking station on the hard surface mat that came with the cleaner. Once resumed, the robot began cleaning in a straight up and down pattern as before. It did seem to adjust fairly quickly, even though in some small areas, it unintentionally went over areas it had finished previously. Once it reached bathroom, the transition from hard floor to carpet did not seem to faze it. Wads of pet hair were instantly sucked up as it continued on its journey. You could also see streaks in the carpet once it finished a pass that resembled traditional vacuum cleaners. In confined areas, the robot naturally took a bit longer to adjust its way out of it, but nonetheless, it was able to find its way out. As the cleaning progressed, once again the learning seemed to improve over time. Interestingly enough, once we called the robot back to base this time, the robot went directly to it as opposed to retracing its previous path. This was quite something. As before, the amount of hair that was picked up was quite a bit for such a small device. Overall, I was quite pleased with how it performed.
With both tests completed, there were a few observations that I think are worth noting. First and foremost, houses of multiple or large pets will have to empty their cleaner much more frequently than the stated 15 days mentioned in the app. Second, the robot could not locate the base if you start it from the dock then move the base to a different room while it is cleaning. Always leave it where it started. Third, after roughly 20 minutes of cleaning, the battery had used about 10%. The charging rate of the battery was also pretty decent. We had left the vacuum cleaner on the dock at 7:30pm with 20% battery. At 10:10pm, the battery was at 60%. In addition, when the robot hits low battery, it will tell you he is low. Lastly, you should move all loose cords out of the way. Our robot got stuck and started to drag some cords, though he did not suck anything up or knock anything over. I would also be mindful of anything fragile on shelves or anything loose that is not sturdy enough to withstand small hits from the robot. The robot never had the force to hit anything tremendously hard, but I rather you take these precautions to avoid an accident. Overall, I was quite happy with the results, though I can certainly say that there are limitations as it can only clean so much. This is certainly a very good supplement to your standard vacuum cleaner as opposed to replacing it. You will still need clean with a regular vacuum cleaner, but nonetheless, I think the robot still does what it was designed to accomplish.
In conclusion, the Shark Robot RV912S performed as it was designed to do. The initial installation and setup was simple and straightforward. Connectively, the application integration and communication was responsive. As the robot cleaning sessions prolonged, the efficiency vastly improved. The robot was able to take more direct paths where it still needed to clean and was aware of areas that it had already finished. In addition, it handled pet hair very well; filling the cleaning bin each time both our tests. As aforementioned, I feel the robot cleaner best acts as a supplement to your standard cleaner. It would not be able to clean everything, nor was it designed to do so. However, this does not diminish what it was able to accomplish. We could tell where it had vacuumed by just looking at the floor. Additionally, the robot was able to eventually navigate the house with ease. Given all of its caveats and features, and provided that you are content with these limitations, the Shark EZ robot should impress. Thus, with that said, the Shark EZ Robot Vacuum cleaner comes recommended.
Mobile Submission: False
I would recommend this to a friend!


Share this review:
+53points
71of 89voted this as helpful.
How much content can you hold with your fingertips? With the Crucial X6 Portable SSD, the answer is: A lot! Whether you’re downloading videos for off-line travel, organizing family photos, collaborating with classmates, or heading off on a great adventure, the Crucial X6 features up to 1TB of portable storage capacity and is ready to go wherever you do.
Posted by: Dragonhunter281
For many, storage size and price are the two main driving factors when choosing an external storage solution. As such, it has become easier in recent years to acquire fast solid state drives for a reasonable price. In addition, with the advent of NVMe based storage, performance and pricing may not always be clear cut. For mainstream drives, it has become harder to differentiate which drive has the faster performance. In an attempt to try and find a fast SSD solution, we must first take a look at the latest SSD offering in Crucial's excellent line of storage solutions, the X6. With capacities ranging from 500 GB - 4 TB of storage, I was excited get my hands on this new drive and could not wait to compare it with other popular solid state drives.
If anyone has already owned a portable SSD, then you are probably familiar with the unbelievably small nature of these units. Simply put, it still amazes me that so much storage can be packed in a small and lightweight solution. In the box, you will find the SSD, a quick start guide, and a USB 3.2 Type-C cable. It did not come with a Type-A adapter, but I already had several from previous SSD drives. Physically, the X6 stands on its own. It is a uniquely square design, clocking in just under 3 inches wide and 2.5 inches tall. Performance wise, crucial has listed the read speeds up to 540 MB/s over USB 3.2 Gen 1, which is comparable to other mainstream models. Setup should be relatively easy. The X6 comes already formatted in eXFAT.
For my tests, I wanted to encapsulate all the Crucial X6 has to offer, as well as compare its blazing speed with other similar models. I decided I would compare the newly released Crucial X6 1TB drive with my SanDisk 500GB Extreme (Model: SDSSDE60-500) as well as the ever popular Samsung T5 1 TB (Model: MU-PA10B). Additionally, for data transfers, I wanted to keep my tests relatively simple to focus on an out of box experience. Aside from doing a quick format, nothing else was changed. As with anything computer related, data and benchmarks can quickly become complicated, especially when you factor in the different ways USB is implemented across a wide range of chipsets. Your results will differ! With this in mind, I wanted to give you an idea on what to expect with this drive given two drastically different computer environments. My first test was to run all drives in a non-USAP environment using Windows 7 Ultimate. I ran all drives over USB 3.0 using a USB Type-C to USB Type-A adapter on my Asus Maximus V Extreme Z77 motherboard. I used the same USB 3.0 port that is tied directly to the Intel Z77 chipset (not the AsMedia chip). My second test was to then use my Asus Flipbook 15 Q538 laptop (2020), this time over Thunderbolt /USB Type-C using Windows 10. The port is rated for 40 GBPS. All tests were conducted with the AC power plugged in. The power mode was set to best performance. Lastly, to compliment my Crystalmark 8.0.2 tests, I manually copied two sets of data. My first data test is one large 37.3 GB bluray image. The second transfer is one large 30.6 GB music folder, but features 5,446 files and 1,166 folders to test the random 4K performance.
Here is the data for all drives using Windows 7 Ultimate from my desktop. Please keep in mind UASP is disabled due to not being supported in Windows 7. To shorten the data, I will only list the Sequential values and Random 4K at a queue depth/ thread of 1 (full results in the pictures).
Crucial: Sequential Read: 371.82 MB/s / Sequential Write: 363.88 MB/s
Crucial: 4K Read (Q1T1): 32.46 MB/s / Random 4K Write (Q1T1): 72.95 MB/s
Samsung: Sequential Read: 368.51 MB/s / Sequential Write: 371.18 MB/s
Samsung: 4K Read (Q1T1): 27.82 MB/s / Random 4K Write (Q1T1): 73.13 MB/s
SanDisk: Sequential Read: 367.25 MB/s / Sequential Write: 371.03 MB/s
SanDisk: 4K Read (Q1T1): 30.76 / Random 4K Write (Q1T1): 74.70 MB/s
As you can see, all the drives perform equally. Despite not supporting UASP, Windows 7 still allows the drive to flex some muscle during my manual transfers. Starting with my 37.3 GB Bluray image, the Crucial X6 transfer started off really high around 540 MB/s mark before falling to 400 MB/s. Half the file was transferred before it leveled off in 360-370 MB/s range before finishing in roughly a minute. This was extremely fast. For my 30 GB music folder, the Crucial X6 was able to hold steady around 180-200 MB/s range. As you can see the transfer was a bit more aggressive, but nonetheless fast. The same behavior was noted on the Samsung T5 on the 37 GB bluray image. The transfer started off around the 540 MB/s range and slowly decreased to around 370 MB/s. The transfer completed shortly thereafter. For my 30 GB music folder, the T5 shot up to around 250 MB/s before slowly dropping to around the 200 MB/s mark. It held consistently for a little bit before holding around the 185-190 MB/s range. Both drives would continue to hold around the same range as the transfer duration prolonged. On my SanDisk 500 GB, the 37 GB bluray image was not as fast as the others, but more constant despite showing similar benchmark numbers. The transfer held steady around 270 MB/s. As for my 30GB music folder, the SanDisk was able to climb just under 200 MB/s and held consistently before dropping to around 190 MB/s. Overall, the Crucial X6 is certainly impressive.
Moving on, the next set of transfers were done on my Asus Flipbook 15, which has a 1 TB Intel SSD. It is accompanied by an additional 32 GB SSD for an Intel Optane configuration. All drives were connected via the 40 GBPS Thunderbolt over USB Type- C port. It is powered by the Intel i7 1165G7 CPU. The results are as follows:
Crucial: Sequential Read: 568.16 MB/s / Sequential Write: 511.74 MB/s
Crucial: 4K Read (Q1T1): 35.78 MB/s / Random 4K Write (Q1T1): 74.32 MB/s
Samsung: Sequential Read: 567.48 MB/s / Sequential Write: 512.26 MB/s
Samsung: 4K Read (Q1T1): 30.07 MB/s / Random 4K Write (Q1T1): 80.85 MB/s
Crucial: Sequential Read: 568.16 MB/s / Sequential Write: 511.74 MB/s
Crucial: 4K Read (Q1T1): 35.78 MB/s / Random 4K Write (Q1T1): 74.32 MB/s
Samsung: Sequential Read: 567.48 MB/s / Sequential Write: 512.26 MB/s
Samsung: 4K Read (Q1T1): 30.07 MB/s / Random 4K Write (Q1T1): 80.85 MB/s
SanDisk: Sequential Read: 567.85 MB/s / Sequential Write: 531.17 MB/s
Sandisk: 4K Read (Q1T1): 29.50 MB/s / Random 4K Write (Q1T1): 56.19 MB/s
Once again, the drives are fairly identical to each other. As expected, the drives were no longer bottlenecked by the operating system. There was a notable difference on the Random 4K (Q32T1) between the Samsung/SanDisk versus the Crucial. I assumed that it could be chipset related, despite having current specifications.
As for my manual transfers, all drives were finally able to stretch their legs as they were no longer bottlenecked by the operating system. Starting with the Crucial X6, my 37GB bluray image held consistently between 385-390 MB/s, despite one instance around the 60% mark of the transfer where it dropped all the way down to 250 MB/s for a few seconds. I still am not sure what caused the dip. My guess would be either the X6 controller, my Intel controller, or the chipset . It may even have been a cache dump on one of the SSDs. I also tried swapping cables but the result was still the same. It certainly should not correspond with the Q32T1 numbers as this is more of a sequential transfer. Regardless, the X6 still finished in respectable time. The 30 GB music folder had no dips and held consistently between 335-350 MB/s. On my T5, the bluray image held consistently around 400-405 MB/s. The 30 GB music folder transferred around 360 MB/s before dipping much like the X6 did on the other transfer to around 250 MB/s. It eventually went back up to 360 MB/s. As for the SanDisk, the 37 GB bluray image dipped sharply in the beginning of its transfer, but quickly shot up to 400-405 MB/s and held it for the whole duration. However, the 30 GB music folder was much more inconsistent. The transfer ranged around 100-280 MB/s before peaking briefly around 315 MB/s but would drop sharply again. It would continue up and down for the remainder of the transfer. Overall, I am impressed with the Crucial X6. Its behavior is certainly on par with the other drives and is more consistent than my SanDisk on the music transfer. In addition, it is very competitive with the T5.
In conclusion, the Crucial X6 is another fabulous entry in the external SSD market. While certainly not targeted as the fastest option, it certainly provides competitive speeds to other models within the same price range. It is compact and sporting a sleek square design allows you to easily move tons of data on the go. While your results will certainly differ, you should see comparable results, if not better depending on the chipset configuration. As it stands, the X6 performed as expected and will certainly please those looking for a fast external SSD. With that, the Crucial X6 comes highly recommended.
Mobile Submission: False
I would recommend this to a friend!


Share this review:
+8points
13of 18voted this as helpful.
Posted by: Dragonhunter281
With the newly released 11th Generation Core Processors, the redesigned Asus Flipbook Q538EI comes ready to attract those who demand performance and elegance in one sleek package. Combining the i7-1165G7 with 16 GB of DDR4-3200 MHz memory and a 1 TB NVMe SSD comes with blazing speed out of the box. In addition, the gorgeous 4K OLED display is fed by a Geforce 1660 Ti that has its own 4 GB of dedicated video memory. Therefore, as an enthusiast, I was excited to see how this monster will perform.
Physically, the Q538 quite attractive. The aluminum brushed body has a smooth brushed feel to it and is of high quality. The mineral grey color certainly looks darker in person. Weight wise, it is roughly four pounds and is not too heavy. The pictures certainly do not do any justice to this laptop. I am fairly confident that most will be extremely pleased with its appearance. Furthermore, along the edge of the laptop and screen is a silver accent that really enhances the overall feel to the Q538. Moving on, we will note a few of the ports that should be straightforward. On the right side, you will note the AC adapter port, two Thunderbolt/USB Type-C ports (40 GBPS), and the power button. Conversely, on the left side, you have one USB 3.1 Gen 1 Type-A Port, 1 HDMI port and an SD card slot. For most, these ports should cover the needs for most. However, I would have liked to have seen one more additional USB Type A port, though it is not a deal breaker. Next, perhaps one of the most standout features of the laptop is the 4k display. I would like to mention that HW Info lists the screen as a Samsung SDC4143. However, there is no denying that the included OLED screen is extremely gorgeous. The display is vibrant and has one of the most colorful glossy panels I have seen in awhile. Everything on the screen pops with color, from normal websites to the Windows 10 start menu. It is definitely one the main highlights of the Q538. You will not be disappointed. Lastly, one quick note. The Q538'sUEFI BIOS was a surprise. The GUI interface was straightforward and easy to navigate. I was glad to see several options that some laptops do not include such as changing the memory allocation for the integrated graphics.
As for performance benchmarks, I wanted to try and encompass a large amount of various tasks to give enthusiasts an idea of what to expect out of the box, without making any changes. The Q538 installation of Windows 10 Home is quite clean, which was refreshing to see. The MyAsus software that comes installed presents some useful presets such as controlling fan profiles and battery modes. As for my performance tests, I focused on the SSD, CPU, and GPU. I used HW Monitor to monitor temperatures and load of the CPU. I used HW Info to provide you accurate information on the hardware contained inside the laptop.
The included 1 TB SSD NVMe drive is listed as an Intel HBRPEKNX0203A and is optane enabled by an additional 32 GB drive. The will note your drive at a capacity of 952 GB. Here are my Crystalmark 8.0 results (full results in pictures).
Intel: Sequential Read: 2083.17 MB / Sequential Write: 1523.54 MB
Intel 4K Read (Q1T1): 116.80 MB / Random 4K Write (Q1T1): 52.89 MB
As you can see the drive is fairly fast as expected. My next test I used my the new Sandisk Extreme 1 TB External SSD V2 (Model: SDSSDE61-1T00) over the Type-C Port. I also did two manual transfers that I will list after. Here are the results (full results in pictures):
Sandisk: Sequential Read: 1002.92 MB / Sequential Write: 1001.03 MB
Sandisk: 4K Read (Q1T1): 37.27 MB / Random 4K Write (Q1T1): 74.11 MB
As you can see the new drive is extremely fast over the Type-C port. For my manual transfer, I did two transfers to the laptop from the Sandisk drive. The first test was a 28 GB M2TS file to show the sequential side of the transfer. The second transfer was a 28.9 GB music folder that contains 5,054 files and 1,152 folders. Both transfers were extremely fast as expected. The first transfer held steady at a blazing 634-659 MB/s and finished in under a minute. The second transfer, despite being more aggressive on the drive, still dazzled despite starting slower. I noted speeds up to 450 MB/s but averaged around 350-400 MB/s ranged. The transfer still finished in roughly a minute. This is mind blowing fast!
The Core i7-1165G7 is a quad core chip with eight processing threads. The CPU has a base of 1.2 GHz and can turbo up to 4.7 GHz at a TDP of 28 Watts. The 10nm chip is seemingly efficient as noted by my Handbrake 1.3.3. encode. I used the 91 minute M2TS file mentioned above and used the Very Fast 1080P preset. I set audio and the frame rate to pass through the source. The encode finished in 27 minutes and 46 seconds! Temperatures, while plugged up to the AC outlet, averaged 70-80C. All cores ran at 3.1 GHz. Shifting focus to more single thread oriented tasks, I used MusicBee 2.4 and LAME 3.99 to encode a 24 minute WAV file to MP3. The encoder was set to a constant bit rate of 320 and the internal algorithm was set to 0 for the highest quality (-q command). MusicBee's maximum encoding thread setting was set to one. The result finished in 1 minute and 14 seconds!
Next I tested the GPU by running the in-game benchmark in Tomb Raider (2012). I set the game to Ultra Quality and increased the anti-aliasing to 2x SSAA. I noted the minimum fps at 56, with an average of 72 fps, and 86 fps for the maximum. These results were at 1080p.These results are extremely good and the game was smooth as butter. As soon as you start a new game and leave the cave, you will note the fps around 70. The fps never dropped below 60, except for when I moved to the next part of the cave, but shot back up to 65. The performance of the 1660 Ti certainly will be able to play some games in high settings, despite the laptop not being really targeted as a gaming machine.
In conclusion, the Asus Flipbook Q538 is an exceptional performing machine. Out of the box, the laptop blazes through everything you throw at rather you are transferring files or even firing up a game or two. The 4K display is absolutely a sight to behold and is extremely vivid and detailed. Everything is bright and colorful. The OLED is definitely one of the best screens I have seen personally on a laptop. Combining top end hardware and a sleek minimalistic design, the Q538 certainly dazzles and will surely excite most who consider purchasing this laptop. However, it might be certainly will be out of reach for some. Overall, if you are considering this, I can assure you that the performance is there for all of your enthusiast needs. With that said, the Asus Q538 comes highly recommended.
Mobile Submission: False
I would recommend this to a friend!


Share this review:
+19points
27of 35voted this as helpful.
Dragonhunter281's Review Comments
Share no-filter moments with this Sony Xperia XZ smartphone. Its 23-megapixel camera has triple image sensing technology to enhance the focus and balance of objects despite movement, distance and low-light conditions for sharper, brighter results. This water-resistant Sony Xperia XZ smartphone has 3GB of memory and 32GB of storage to let you save 4K recorded videos and download apps.
Overall5 out of 5
5 out of 5Great, Unique Phone
By Jstar
This review turned out a lot longer than originally thought but this is a big purchase so I did not want to miss anything and wanted to share my experience with you. I know I would appreciate what I have to say below :)
I bought this phone to replace my 4.5 year-old lg optimus that had grown outdated but still was in great working condition. As I have an iPhone for work and do not care for it much, I researched phones heavily this past year and narrowed it down to making the tough choice between the Xperia XZ and the Galaxy s7 Edge. Since I was finally getting a new phone I did not just want to get the one everyone said was the 'best', I wanted to put my money towards the phone that would provide me with a unique experience with top of the line specs and I am very happy I went with the Xperia XZ.
First off the phone is beautiful. Many online reviews said this phone was not particularly attractive to non-Sony Phone buyers and after having the phone for a few weeks I respectfully disagree. Maybe it is just the Forest Blue color, but I have repeatedly been asked what kind of phone I had while at work or in-line in stores by people who think the phone is "really cool" or in another case "super cute". It is a design/color that seems to appeal to a lot of people. I thought I would have a problem with the increase in screen size from my old phone, but I am a tall guy with big hands and have no problem reaching the entire screen with my thumb while holding it in one hand. My girlfriend uses two hands but she does so with her iPhone as well so I would not hold that against the Xperia but just thought I would note it because the one hand use was important to me.
As for the phone itself I have no complaints. Again I note the age of my old phone, so any phone would probably be a nice change in speed and such, but it was very easy to transfer my old data to the XZ and it is incredibly quick and responsive when using apps. The display is stunning with excellent color contrast. The camera takes excellent pictures, haven't tried too many selfies but scenes look great and capture motion very well. I am a big fan of the camera shutter button and notification light, quick charge is nice. The battery goes a day of occasionally gaming and internet browsing once you fine-tune the settings. I was initially upset about the lack of the fingerprint scanner but I saw the hardware for it is on the US version and you can enable with a little software work around, but it will void the warranty so I have not gotten around to trying that yet. But honestly with the smart-lock and security settings, the phone is unlocked whenever it is near me so it is really not a big deal at all. The Lifelog and Xperia Lounge apps are cool and provide great exercise feedback and free perks respectively. I am also happy to report the water proofing does work to at least some degree as the first thing I did when I received the phone was run it under the sink for a while and it worked no problem.
I am a big Sony fan so I was very interested to see how it faired remote playing my ps4. Once I paired my controller with my phone it was smooth sailing and playing Dark Souls was far easier than I expected it would be. I did not try playing online multiplayer through remote play yet but even with my Vita that can be very leggy so I expect it would be similar with the XZ.
In conclusion, I love my other Sony products and am happy to have the Xperia XZ join that list of awesome products. I disagree with the professional reviews about the phones appearance design wise as well as their BIG issue with lack of fingerprint reader. It's design seems to draw lots of appeal in my experience and is a welcome change to the similarly designed Galaxy, iPhone, and Pixel. The phone is definitely not cheap, but if you are looking to upgrade your old phone and want to put your money towards a phone that is at the very least equivalent to if not better than the other flagship phones out there in addition to catching peoples attention and providing a more unique experience, than the Xperia XZ is the perfect choice. As I said my old phone was outdated and I am a big Sony fan so I may be bias, but comparing this to my friends new galaxy and my girlfriends iPhone 6s, I know I made the right choice going with the Xperia XZ.
As an added note, I will say finding special cases will be hard for the XZ as it is not a very common phone, but if you get the Forest Blue I would recommend a clear color because the phone looks great as is.
Dragonhunter281
October 31, 2016
Thank you for review. I never understood why the "professional" reviews always trashed Sony. Their designs had always been different and for once where innovation could be actually used appropriately, they are criticized for it. If you look at user reviews of this phone elsewhere, you will see how rampant this is as they just repeat the same complaints reviews have. The fingerprint scanner is extremely overrated and glad you mentioned this because it really isn't a needed feature as the media makes it out to be. If swiping is hard to unlock the phone, then people have really lost it. Anyways, glad to see a fair review and hopefully I can try this phone out if I decide to replace my Z3+, although so far I have had zero issues with it.
+4points
4of 4voted this comment as helpful.
Dragonhunter281's Questions
Dragonhunter281 has not submitted any questions.
Dragonhunter281's Answers
Conquer virtual enemies with this Dell Inspiron desktop. It has an AMD Radeon graphics card with 8GB of dedicated video memory for fast image rendering, and its powerful AMD Ryzen 7 processor and 16GB of DDR4 RAM run multiple programs, games and browsers simultaneously. This Dell Inspiron desktop has a 1TB hard drive for plenty of long-term game storage.
This Desktop Says, It doesnt have a mouse included, Can you please recommend me a mouse for this? Also How many watts for the psu? And is it a 80+ Psu atleast?
The desktop does come with a basic USB mouse and keyboard. The power supply is total 460 watts and there is no 80 plus certification logo on the power supply itself. As for a mouse, I currently use the Razer Taipan 8200 DPI mouse and its pretty comfortable.

6 years, 8 months ago
by
Dragonhunter281
Conquer virtual enemies with this Dell Inspiron desktop. It has an AMD Radeon graphics card with 8GB of dedicated video memory for fast image rendering, and its powerful AMD Ryzen 7 processor and 16GB of DDR4 RAM run multiple programs, games and browsers simultaneously. This Dell Inspiron desktop has a 1TB hard drive for plenty of long-term game storage.
What is the power supply for this pc
The power supply of this particular unit is total 460 watts.
6 years, 8 months ago
by
Dragonhunter281
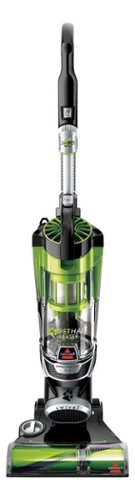
Nothing puts a vacuum to the test quite like a home with pets. That's why the BISSELL® Pet Hair Eraser® was developed from the ground up by pet parents for pet parents. Whether it's shedding season for your dog or your cat tracks kitty litter all over the house, this revolutionary vacuum is designed to make cleaning up after pets and the people who love them a breeze—from beginning to end. Say goodbye to hair wrap with its Tangle-Free Brush Roll, remove embedded hair everywhere with specialized pet tools, help capture allergens and eliminate odors with the SmartSeal™ Allergen System, and when you're finished cleaning, enjoy a hands-free tank empty with our patented Cyclonic Spooling System™.BR>
Does this unit have an off/on switch for the roller bar? Bissell's website says yes, but Best Buy & Lowes websites say no.
Yes, the vacuum cleaner does have an on/off switch for the roller bar. It also shuts off when it is shifted back to upright position.
Hope this helps !
Hope this helps !
7 years, 7 months ago
by
Dragonhunter281